Pythonで積上げ棒グラフを描く ― 基礎編

仕事のため試行錯誤しながら積上げ棒グラフを作ったので、備忘録としてやり方をまとめておきます。ここではOur World in Dataから入手した国別・年齢層別人口データを用いて描いてみます。
外部ライブラリのインストールがまだなら
conda install requests pandas matplotlib seaborn -yまたは
pip install requests pandas matplotlib seaborn -yと打ってインストールしておきます。次に、データをPandasのdataframeとして読み込みます。
import io
import re
import requests

url = 'https://abittechnical.work/wp-content/uploads/2024/06/population-by-age-group.csv'
content = requests.get(url).content
df = pd.read_csv(io.StringIO(content.decode('utf-8')))
df.head()| Entity | Code | Year | Population by broad age group - Sex: all - Age: 65+ - Variant: estimates | Population by broad age group - Sex: all - Age: 25-64 - Variant: estimates | Population by broad age group - Sex: all - Age: 15-24 - Variant: estimates | Population by broad age group - Sex: all - Age: 5-14 - Variant: estimates | Population by broad age group - Sex: all - Age: 0-4 - Variant: estimates |
|---|---|---|---|---|---|---|---|
| Afghanistan | AFG | 1950 | 213022 | 2773093 | 1425494 | 1820573 | 1248282 |
| Afghanistan | AFG | 1951 | 216096 | 2803308 | 1446694 | 1858587 | 1246857 |
| Afghanistan | AFG | 1952 | 219028 | 2834902 | 1468534 | 1896850 | 1248220 |
| Afghanistan | AFG | 1953 | 221925 | 2866392 | 1489850 | 1931657 | 1254725 |
| Afghanistan | AFG | 1954 | 224755 | 2898163 | 1510311 | 1963243 | 1267817 |
グラフ用にデータを整形します。drop_duplicatesで最新のデータのみ抽出し総人口が大きい順に並べ替えます。
population = (df
              [~df.Code.isin(['OWID_WRL', np.nan])]
              .drop_duplicates(subset='Code', keep='last')
              .rename(columns={col: re.search(r'Age: (\S+) - Variant', col).groups()[0]
                               for col in df.columns[3:]})
              .assign(total=lambda df: df.loc[:, '65+':].sum(axis=1))
              .sort_values('total', ascending=False)
              .reset_index(drop=True)
              )
グラフの見栄えを設定します。
from matplotlib import pyplot as plt
from matplotlib import rcParams

rcParams.update(
    {
        "axes.spines.top": False,
        "axes.spines.right": False,
        "axes.formatter.use_mathtext": True,
        "axes.formatter.limits": [-3, 3],
        "lines.linewidth": 1,
        "legend.frameon": False,
        "font.size": 11,
        "text.usetex": False,
        "font.family": ["Helvetica Neue", 'DejaVu Sans', "IPAexGothic", "sans-serif"],
        'svg.fonttype': 'none',
    }
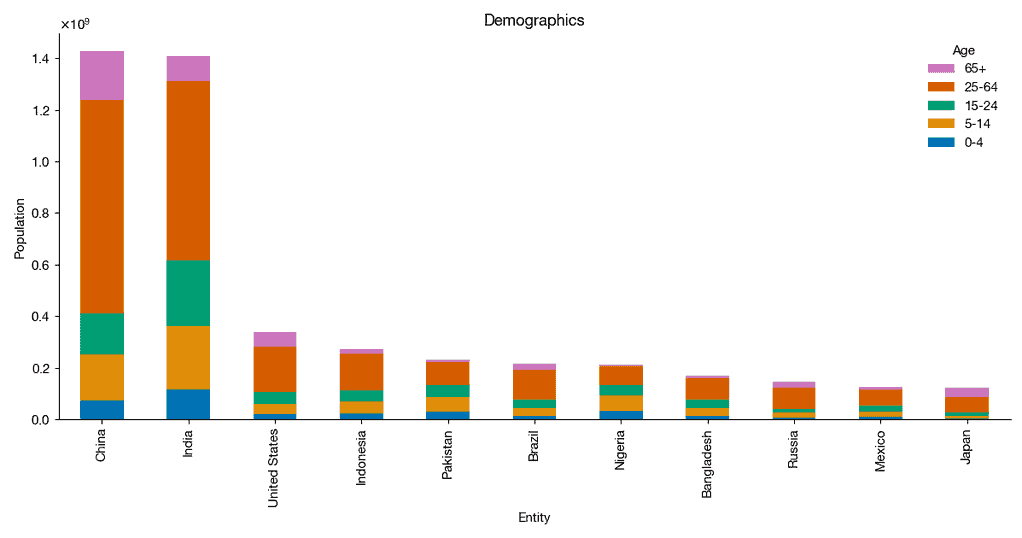
)Pandasのplot.barメソッドを使い、人口数上位10ヶ国の年齢別人口を可視化します。
import numpy as np
import pandas as pd
import seaborn as sns

n = 10
fig, ax = plt.subplots(figsize=(12, 6.3))
population.loc[:n].plot.bar(ax=ax,
                            x=0, y=range(7, 2, -1),
                            stacked=True,
                            color=sns.color_palette('colorblind'))
ax.legend(reverse=True, title='Age')
ax.set_ylabel('Population')
ax.set_title('Demographics')
plt.tight_layout()
より複雑な積上げ棒グラフの作り方について次の記事で解説します。

