Data-Driven Science and Engineering. Chapter 2 Exercises


I used Python and worked on exercises in Chapter 2 of Data-Driven Science and Engineering, 2nd Edition (2022).
Preliminaries
%matplotlib inline
import io
from pathlib import Path
import urllib
import pandas as pd
import numpy as np
import scipy
from matplotlib import rcParams
from matplotlib import pyplot as plt
from matplotlib.image import imread

A4 = [8.27, 11.69]

rcParams.update(
    {
        "axes.spines.top": False,
        "axes.spines.right": False,
        "axes.formatter.use_mathtext": True,
        "axes.formatter.limits": [-3, 3],
        "lines.linewidth": 1,
        "lines.markersize": 5,
        "lines.markeredgewidth": 0.5,
        "lines.markeredgecolor": "white",
        "legend.frameon": False,
        "font.size": 11,
        "text.usetex": False,
        "font.family": ["Helvetica Neue", "IPAexGothic", "DejaVu Sans", "sans-serif"],
    }
)

def download(url):
    obj = io.BytesIO()
    user_agent = "Mozilla/5.0 (Windows NT 6.1; Win64; x64)"
    headers = {"User-Agent": user_agent}
    req = urllib.request.Request(url, None, headers)
    with urllib.request.urlopen(req) as response:
        obj.write(response.read())
    return obj

def normalize(a):
    return a / (a.max() - a.min())

url_dog = "https://abittechnical.work/wp-content/uploads/2023/08/dog.jpg"
dogpict_original = imread(download(url_dog), format="jpg")
Exercise 2.1
Load the image dog.jpg and convert to grayscale. Use the FFT to compress the image at different compression ratios. Plot the error between the compressed and actual image as a function of the compression ratio.
B = normalize(dogpict_original.mean(axis=-1)[::3, ::3])
Bt = np.fft.fft2(B)
Btsort = np.sort(np.ravel(np.abs(Bt)))
for i in range(3, 7):
    fig, ax = plt.subplots(figsize=(5, 6.67))
    keep = 1 / 10 ** (0.5 * i)
    threshold = Btsort[int(np.floor((1 - keep) * len(Btsort)))]
    Atlow = Bt * (np.abs(Bt) > threshold)
    img = np.fft.ifft2(Atlow).real
    ax.imshow(img, cmap="gray")
    ax.axis("off")
    plt.tight_layout(pad=0)


keeps = np.concatenate([np.array([0]), np.logspace(-5, 0, 11)])
norms = np.array([np.linalg.norm(B - B.mean())])
for keep in keeps[1:]:
    threshold = Btsort[int(np.floor((1 - keep) * len(Btsort)))]
    Atlow = Bt * (np.abs(Bt) > threshold)
    img = np.fft.ifft2(Atlow).real
    norms = np.concatenate([norms, np.array([np.linalg.norm(B - img)])])

from matplotlib import ticker

fig = plt.figure(figsize=(8, 3))
ax = fig.add_subplot(1, 2, 1)
ax.plot(keeps, norms, "-o", clip_on=False)
ax.set_xscale("symlog", linthresh=keeps[keeps > 0].min())
ax.set_xlim(0, 1)
ax.set_ylim(0, 1.05 * norms.max())
ax.set_xlabel("Compression ratio")
ax.set_ylabel("Error")

ax = fig.add_subplot(1, 2, 2)
ax.plot(keeps, 100 * (1 - norms / norms.max()), "-o", clip_on=False)
ax.set_xscale("symlog", linthresh=keeps[keeps > 0].min())
ax.set_xlim(0, 1)
ax.set_ylim(0, 100)
ax.yaxis.set_major_formatter(ticker.PercentFormatter())
ax.set_xlabel("Compression ratio")
ax.set_ylabel("Accuracy")

Exercise 2.2
Consider the following triangular wave:
\(f(x) = \left\{
\begin{array}{ll}
0 & (1 \lt |x|) \\
1-|x|& (|x| \le 1)
\end{array}
\right.\)
Compute the Fourier series by hand for the domain \(−2 \le x \lt 2 \) . Plot the mode coefficients \(a_n\) and \(b_n\) for the first 100 cosine and sine modes (i.e., for the first \(n = 1\) to \(n = 100\)). Also, plot the approximation using \(n=20\) modes on top of the true triangle wave.
In a few sentences, explain the difference between the Fourier transform and the Fourier series.
def a(n):
    return (n == 0) * 1 / 2 + (n != 0) * 4 / np.where(
        n != 0, np.power(n * np.pi, 2), 1
    ) * (1 - np.cos(n * np.pi / 2))


def b(n):
    return 0


def c(k, x):
    return (k == 0) * a(k) / 2 * np.ones_like(x) + (k != 0) * (
        a(k) * np.cos(k * np.pi * x / 2) + b(k) * np.cos(k * np.pi * x / 2)
    )


X = np.linspace(-2, 2, 200)
ft = 0

fig = plt.figure(figsize=(8, 3))
ax = fig.add_subplot(1, 2, 1)
for k in range(20):
    ft += c(k, X)
    ax.plot(X, c(k, X), ":")
ax.plot(X, ft, "-k", linewidth=2)
ax.set_xlabel("$x$")
ax.set_ylabel("$f(x)$")

N = np.arange(1, 101)
ax = fig.add_subplot(1, 2, 2)
ax.plot(N, a(N), label="a", clip_on=False)
ax.set_xlim(0, N.max())
ax.set_ylim(0, ax.get_ylim()[1])
ax.set_xlabel("n")
ax.set_ylabel("$a_{n}$")

Exercise 2.3
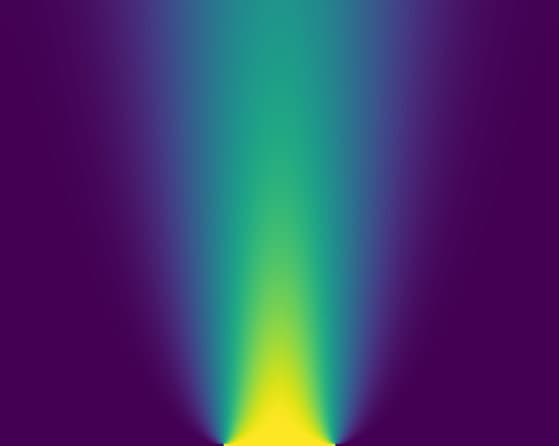
Use the FFT to solve the Korteweg–de Vries (KdV) equation, \(u_t + u_{xxx} − uu_{x }= 0\), on a large domain with an initial condition \(u(x, 0) = sech(x)\). Plot the evolution.
I started off with an easier equation, the heat equation, by modernizing the book authors' Python code. The obsolete spicy.integrate.odeint function for ordinary differential equations is now replaced with solve_ivp in the same library.
from scipy.integrate import solve_ivp
from scipy.interpolate import interp1d
from mpl_toolkits.mplot3d import axes3d

# Parameters
a = 1  # Thermal diffusivity constant
L = 100  # Length of domain
N = 1000  # Number of discretization points
dx = L / N
x = np.arange(-L / 2, L / 2, dx)  # Define x domain

# Define discrete wavenumbers
kappa = 2 * np.pi * np.fft.fftfreq(N, d=dx)

# Initial condition
u0 = np.zeros_like(x)
u0[int((L / 2 - L / 10) / dx) : int((L / 2 + L / 10) / dx)] = 1
u0hat = np.fft.fft(u0)
t_span = (0, 100)

# Diffierential equation
def rhsHeat(t, uhat, kappa, a):
    d_uhat = -(a**2) * (np.power(kappa, 2)) * uhat
    return d_uhat

# Solution
results = solve_ivp(rhsHeat, t_span=t_span, y0=u0hat, args=(kappa, a))

t_ = results.t
uhat = results.y
u_ = np.fft.ifft(uhat, axis=0).real
t = np.linspace(t_[0], t_[-1], 200)
f = interp1d(t_, u_, axis=1)
u = f(t)

# Waterfall plot
fig = plt.figure()
ax = fig.add_subplot(111, projection="3d")

u_plot = u[:, 0:-1:10]
for j in range(u_plot.shape[1]):
    ys = j * np.ones(u_plot.shape[0])
    ax.plot(x, ys, u_plot[:, j])

# Image plot
fig, ax = plt.subplots()
ax.imshow(np.flipud(u.T), aspect=2)
ax.axis("off")

# Animation
from matplotlib import animation, rc

images = []
fig, ax = plt.subplots(figsize=(8, 6))
# ax.spines["bottom"].set_position("zero")
ax.set_ylim(0, 1)
for j in range(u.shape[1]):
    img = ax.plot(x, u[:, j], color="b", clip_on=False)
    images.append((img[0],))
anime = animation.ArtistAnimation(
    fig,
    images,
    interval=20,
    repeat_delay=800,
)
rcParams.update({"animation.html": "jshtml"})
anime


For the KdV equation, the following part of the code is replaced. \(u u_x\) is transformed by using \(\widehat{u u_x} = \int_{-\infty}^{\infty}uu_x e^{-i\kappa x} dx = \int_{-\infty}^{\infty}\frac{1}{2}\frac{d(u^2)}{dx} e^{-i\kappa x} dx = \frac{1}{2}i\kappa\widehat{u^2}\).
# Parameters
alpha, beta = -1, 1

# Initial Condition
u0 = -np.cos(2 * np.pi * x / L)
t_span = (0, 200)


# Diffierential equation
def rhsKdV(t, uhat, alpha, beta, kappa):
    u = np.fft.ifft(uhat).real
    d_uhat = (
        -alpha * 1j * kappa * np.fft.fft(u * u / 2)
        + beta * 1j * np.power(kappa, 3) * uhat
    )
    return d_uhat

# Solution
results = solve_ivp(
    rhsKdV,
    t_span=t_span,
    y0=u0hat,
    args=(
        alpha,
        beta,
        kappa,
    ),
    method="DOP853",  # default RK45 fails at t=~0.5.
)


Exercise 2.8 [MATLAB]
Now, we will use the FFT to simultaneously compress and re- master an audio file. Please download the file r2112.mat and load the audio data into the matrix rush and the sample rate FS.
- Listen to the audio signal (»sound(rush,FS);). Compute the FFT of this audio signal.
- Compute the power spectral density vector. Plot this to see what the output looks like. Also plot the spectrogram.
- Now, download r2112noisy.mat and load this file to initialize the variable rushnoisy. This signal is corrupted with high-frequency artifacts. Manually zero the last three-quarters of the Fourier components of this noisy signal (if n=length(rushnoisy), then zero-out all Fourier coefficients from n/4:n). Use this filtered frequency spectrum to reconstruct the clean audio signal. When reconstructing, be sure to take the real part of the inverse Fourier transform: cleansignal=real(ifft(filteredcoefs));.Because we are only keeping the first quarter of the frequency data, you must multiply the reconstructed signal by 2 so that it has the correct normalized power. Be sure to use the sound command to listen to the pre- and post-filtered versions. Plot the power spectral density and spectrograms of the pre- and post-filtered signals.
import IPython


def normalize2(a):
    return 2 * (a - a.min()) / (a.max() - a.min()) - 1


r2112url = "http://faculty.washington.edu/sbrunton/me565/hw/r2112.mat"
r2112noisyurl = "http://faculty.washington.edu/sbrunton/me565/hw/r2112noisy.mat"
r2112dat = scipy.io.loadmat(download(r2112url))
r2112noisydat = scipy.io.loadmat(download(r2112noisyurl))
rush = normalize2(r2112dat["rush"][:, 0])
rushnoisy = normalize2(r2112noisydat["rushnoisy"][:, 0])
rate = r2112dat["FS"][0][0]
IPython.display.Audio(rush, rate=rate)
IPython.display.Audio(rushnoisy, rate=rate)
fig = plt.figure(figsize=(8, 6))
for i, x in enumerate([rush, rushnoisy]):
    fp, Pxx = scipy.signal.periodogram(x, fs=rate)
    fs, t, Sxx = scipy.signal.spectrogram(x, fs=rate)

    ax = fig.add_subplot(2, 2, i + 1)
    ax.plot(fp, Pxx)
    ax.set_xscale("log")
    ax.set_ylim(0, ax.get_ylim()[1])
    ax.set_xlabel("Frequency [Hz]")
    ax.set_ylabel("PSD")
    ax.set_title(["rush", "rushnoisy"][i])

    ax = fig.add_subplot(2, 2, i + 3)
    ax.pcolormesh(
        t,
        fs[1:],
        Sxx[1:, :],
        shading="gouraud",
    )
    ax.set_yscale("log")
    ax.set_xlabel("Tile [sec]")
    ax.set_ylabel("Frequency [Hz]")

plt.tight_layout()


rushnoisy_hat = np.fft.fft(rushnoisy)
rushnoisy_hat[int(n / 4) :] = 0
rush_cleaned = 2 * np.fft.ifft(rushnoisy_hat).real
IPython.display.Audio(rush_cleaned, rate=rate)
Exercise 2.9
The convolution integral and the impulse response may be used to simulate how an audio signal would sound under various conditions, such as in a long hallway, in a concert hall, or in a swimming pool.
The basic idea is that you can record the audio response to an impulsive sound in a given location, like a concert hall. For example, imagine that you put a microphone in the most expensive seats in the hall and then record the sound from a shotgun blast up on the stage. (Do not try this!!) Then, if you have a “flat” studio recording of some other audio, you can simulate how it would have sounded in the concert hall by convolving the two signals.
Download and unzip sounds.zip to find various sounds and impulse-response filters. Convolve the various audio files (labeled sound1.wav, . . . ) with the various filters (labeled FilterXYZ.wav, . . . ). In MATLAB, use the wavread command to load and the conv command to convolve. It is best to add 10% of the filtered audio (also known as “wet” audio) to 90% of the original audio (also known as “dry” audio). Listen to the filtered audio, as well as the original audio and the impulse-response filters (note that each sound has a sampling rate of FS=11,025). However, you will need to be careful when adding the 10% filtered and 90% unfiltered signals, since the filtered audio will not necessarily have the same length as the filtered audio.
There is a great video explaining how to actually create these impulse responses: www.audioease.com/altiverb/sampling.php

