Double-byte Fonts Garbled in Mac matplotlib-Generated PDFs
Update: I came up with a better solution in a subsequent post.
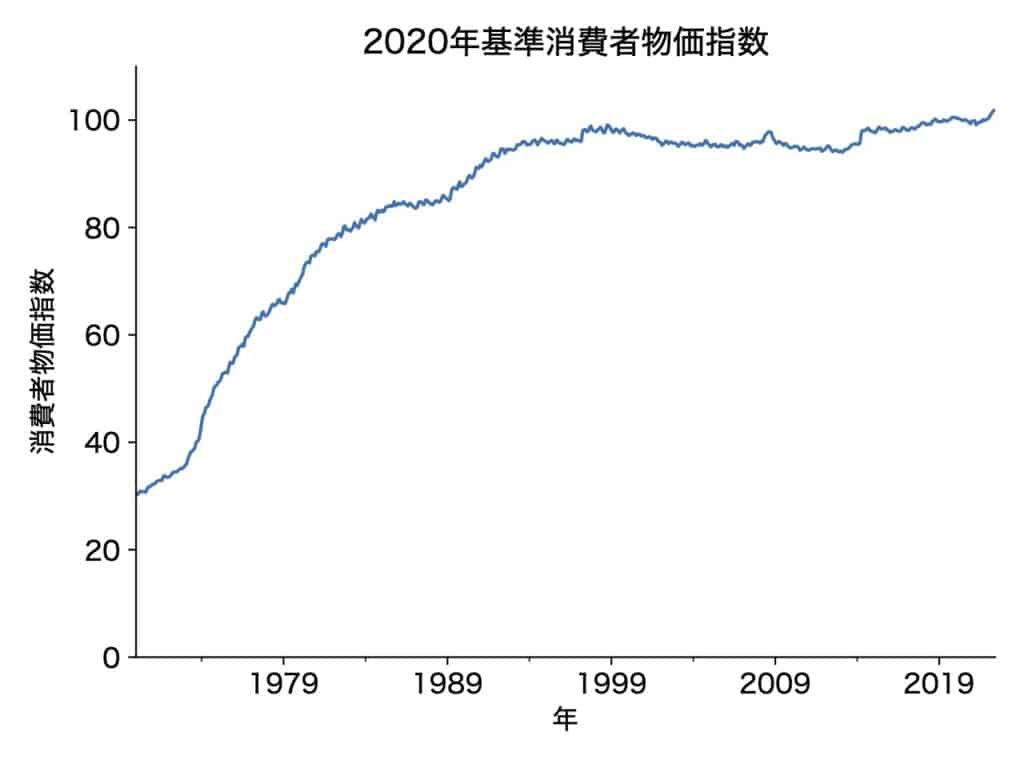
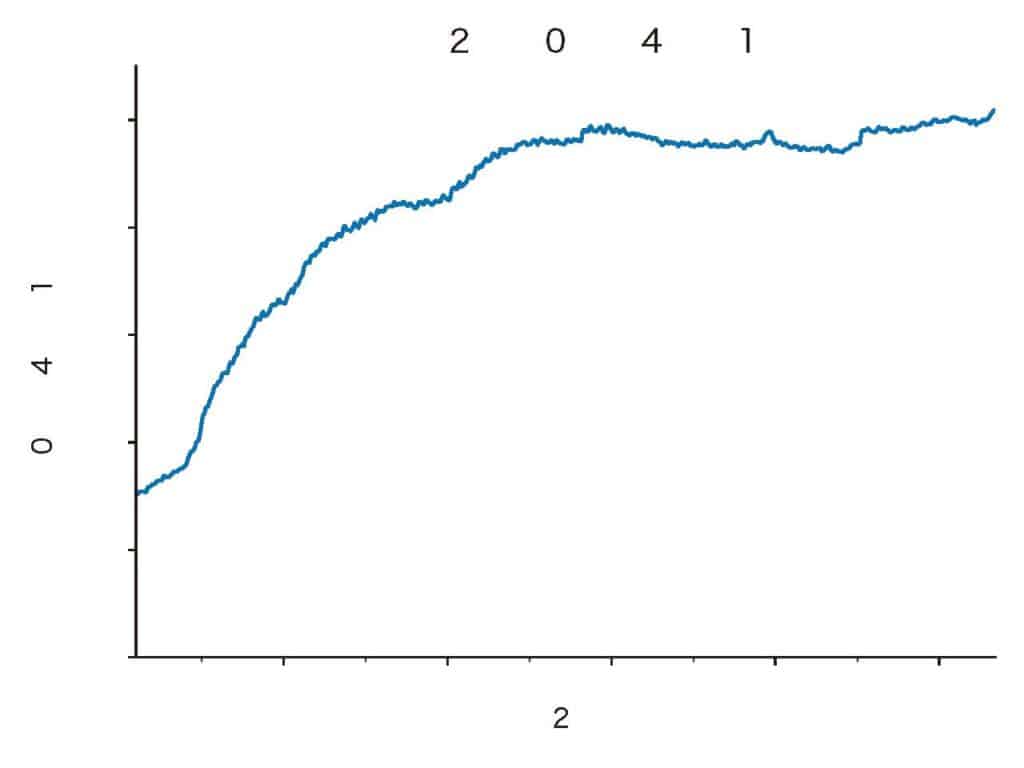
matplotlib is a popular plotting library for Python. To my annoyance, it garbles double-byte fonts like Japanese Higragino when it saves plots in PDF format, probably since I updated macOS to Version 13 Ventura. Characters are unreadable in Adobe Acrobat Reader while they look fine in Preview.app, making it hard to recognize the issue. It seems Acrobat gets confused by matplotlib-generated PDFs and fails to fall back on a single-byte font. I've come up with makeshift solutions by trial and error.
Environment
macOS 13.0.1, Python 3.9.13 , Pandas 1.5.2, matplotlib 3.6.2
Makeshift solutions
- save figures in PDF format→have Affinity Publisher 2 export them in PDF format
- save figures in PDF format →open them in the edit mode in Acrobat Pro and assign a double-byte font where appropriate. This can be cumbersome if you want to use multiple fonts or have lots of subplots.
Attempts that didn't work out
- Clear font cache by typing
rm -f ~/.matplotlib/*in a terminal window. - save figures in PDF format→have Preview.app print them in PDF format, only to generate as many corrupt files.
- save figures in PS format→export them in PDF format in Preview.app. The current version of Preview cannot open PS files in the first place, although it could before.
- save figures in PS format→convert them into PDFs in Acrobat Pro. The Distiller log says
%%[ Error: invalidfont; OffendingCommand: findfont ]%%.
Script for the figure above
import pandas as pd
from matplotlib import pyplot as plt
from matplotlib import rcParams

url= "https://www.stat.go.jp/data/cpi/2020/youshiki/csv/zmi2020s.csv" #1
cpi = (pd.read_csv(url,
        encoding="cp932",
        skiprows=[1, 2, 3, 4, 5],
        usecols=["類・品目", "総合"])
    .assign(date=lambda df:
        pd.to_datetime(df["類・品目"].astype("str"),
        format="%Y%m"))
    .drop("類・品目", axis=1)
    .set_index("date")
    ["総合"]
)

rcParams["axes.spines.top"] = False
rcParams["axes.spines.right"] = False
rcParams["font.family"] = "Hiragino Sans"
rcParams["pdf.fonttype"] = 42

fig, ax = plt.subplots()
cpi.plot(
    ax=ax,
    title="2020年基準消費者物価指数",
    legend=False,
    ylim=[0, 110],
    xlabel="年",
    ylabel="消費者物価指数"
)
fig.savefig("cpi.pdf")
#1. As of Dec. 8, 2022, the Statistic Bureau of Japan's website links this URL to an erroneous file.

One thought on “Double-byte Fonts Garbled in Mac matplotlib-Generated PDFs”