data science
Stacked Bar Chart in Python - Advanced
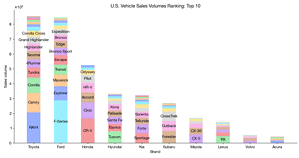
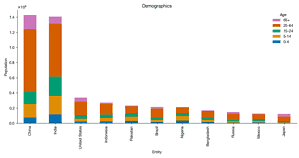
In this advanced tutorial, we delve deeper into the art of creating stacked bar charts using Python. Building upon our previous basic tutorial, we explore more sophisticated techniques to handle complex data structures and add attributes to our visualizations. We utilize data from Our World in Data to craft a country and age demographic stacked bar chart, and then we take on a new challenge: visualizing sales data for car models by different manufacturers. We begin by installing necessary external libraries and importing data from goodcarbadcar.net into a Pandas dataframe. The tutorial guides you through the process of creating a ranking of year-to-date sales by brand and setting up the […]
Creating Stacked Bar Charts in Python: A Beginner’s Guide
Data visualization is an essential aspect of data science, allowing us to understand complex data sets at a glance. One of the most effective visual tools is the stacked bar chart, which can display multiple data series stacked on top of one another. In this article, we’ll explore how to create stacked bar charts in Python using a practical example. Preparing the Environment Before diving into the data, we need to set up our Python environment. This involves installing external libraries such as requests, pandas, matplotlib, and seaborn. These can be installed using either conda or pip, depending on your preference. Getting Started with the Data Our journey begins with the acquisition of data. For this tutorial, […]
Data-Driven Science and Engineering. Chapter 3 Exercises
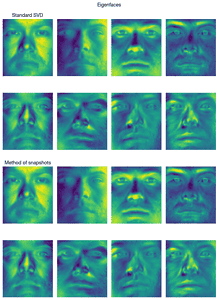
I used Python and worked on exercises in Chapter 3 of Data-Driven Science and Engineering, 2nd Edition (2022).
Data-Driven Science and Engineering. Chapter 2 Exercises
I used Python and worked on exercises in Chapter 2 of Data-Driven Science and Engineering, 2nd Edition (2022). I started off with an easier equation, the heat equation, by modernizing the book authors' Python code. The obsolete spicy.integrate.odeint function for ordinary differential equations is now replaced with solve_ivp in the same library. For the KdV equation, the following part of the code is replaced. \(u u_x\) is transformed by using \(\widehat{u u_x} = \int_{-\infty}^{\infty}uu_x e^{-i\kappa x} dx = \int_{-\infty}^{\infty}\frac{1}{2}\frac{d(u^2)}{dx} e^{-i\kappa x} dx = \frac{1}{2}i\kappa\widehat{u^2}\). Hide · Rush Hide · Rushnoisy Hide · Rush Cleaned
Data-Driven Science and Engineering. Chapter 1 Exercises
I used Python and worked on exercises in Chapter 1 of Data-Driven Science and Engineering (2022).
How to Successfully install PyCaret on M1 Mac
Conda-forge provides an older version of PyCaret than PIP (2.3.10 vs. 3.0.2 as of June 1, 2023). You can install the latest version of PyCaret on M1 Mac by entering the following commands.
Solution to Garbled Double-Byte Fonts in Mac Matplotlib-Generated PDFs
Double-byte fonts like Japanese and Chines ones are garbled in Mac matplotlib-generated PDFs when viewed in Adobe Acrobat. This article provides a solution.
You Need to Replace Miniforge Version of Miniconda to Get Latest one
My Mac's Miniconda was old (version 4.11.0). There seemed to be a much newer version 22.11.1 available, but when I typed 'conda update -n base conda' in the terminal as instructed, the update didn't take effect (see the output below). It also looked like various issues had accumulated. Upon recollection, I installed Miniconda with Miniforge when the official Conda version for Apple Silicon was still unavailable. Conda is an open-source package management and environment management system for installing multiple versions of software packages and their dependencies and switching easily between them. It is commonly used for data science, scientific computing, and machine learning. Miniconda is a minimal distribution of Conda. […]
How to set up Jupyter on Visual Studio Code - A comprehensive guide with sample projects
Learn how to set up Jupyter on Visual Studio Code with this comprehensive guide. Discover the benefits of using Jupyter in Visual Studio Code, and follow step-by-step instructions to get started. Try sample projects to familiarize yourself with the tools and optimize your data science and development workflow.
Collaborating on Jupyter Lab: How to Improve Your Data Science Workflow as a Team
Jupyter Lab is a powerful open-source web-based platform for interactive computing and data science. It allows users to create and share documents that contain live code, equations, visualizations, and narrative text. The platform has become increasingly popular among data scientists and researchers, and it's easy to see why. In this article, we will explore how Jupyter Lab can be used for collaboration and teamwork and how it can help organizations to improve their data science workflow. Collaboration features in Jupyter Lab Collaboration is a crucial aspect of data science and research. Jupyter Lab provides several features that make it easy for teams to work together. The platform allows multiple users […]
Double-byte Fonts Garbled in Mac matplotlib-Generated PDFs
In Mac matplotlib-generated PDFs, double-byte characters are unreadable in Adobe Acrobat Reader while they look fine in Preview.app.
Pandas: Reproduction of Microarray Study Results
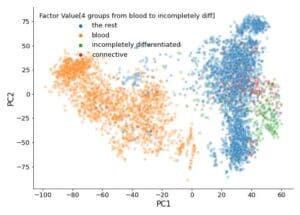
This is a step-by-step guide to reproduce the results of a microarray study by using Pandas, scikit-learn, and other Python scientific libraries. Here, my target is the principal component analysis (PCA) conducted in Lukk M, Kapushesky M, Nikkilä J, et al. A global map of human gene expression. Nat Biotechnol. 2010;28:322-324. doi:10.1038/nbt0410-322. Data retrieval The authors provide all their datasets at the repository 'E-MTAB-62 - Human gene expression atlas of 5372 samples representing 369 different cell and tissue types, disease states and cell lines.' Let's look and see what's there. Four files are listed in addition to lots of raw data. Namely, E-MTAB-62.idf.txt Investigation description E-MTAB-62.sdrf.txt Sample and data relationship […]
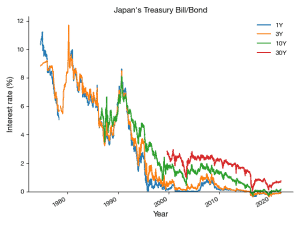
How to Get Japan's Treasury Interest Rates Retrieved in Pandas
Steps The Ministry of Finance provides the historical data of Japan's Treasury interest rates here. https://www.mof.go.jp/english/policy/jgbs/reference/interest_rate/historical/jgbcme_all.csv You can import and convert the data directly into a dataframe using Pandas' read_csv function. Since there are three digits below the decimal point and interest rates seem unlikely to have exceeded 100% in the last half-century in Japan, five significant figures will be sufficient, and thus I can safely set the dtype as np.float16. 1Y 2Y 3Y 4Y ... Date 1974-09-24 10.327 9.362 8.830 8.515 ... 1974-09-25 10.333 9.364 8.831 8.516 ... 1974-09-26 10.340 9.366 8.832 8.516 ... 1974-09-27 10.347 9.367 8.833 8.517 ... Here is the code for the chart above.
