日本国債金利の時系列データをPandasに取り込む

方法
財務省の国債金利情報ページからヒストリカルデータのCSVをダウンロードできます。これをPandasのDataFrameに読み込みます。まずはデータを見てみましょう。
https://www.mof.go.jp/jgbs/reference/interest_rate/data/jgbcm_all.csv
国債金利情報,,,,,,,,,,,,,,,(単位 : %)
基準日,1年,2年,3年,4年,5年,6年,7年,8年,9年,10年,15年,20年,25年,30年,40年
S49.9.24,10.327,9.362,8.83,8.515,8.348,8.29,8.24,8.121,8.127,-,-,-,-,-,- S49.9.25,10.333,9.364,8.831,8.516,8.348,8.29,8.24,8.121,8.127,-,-,-,-,-,- S49.9.26,10.34,9.366,8.832,8.516,8.348,8.29,8.24,8.122,8.128,-,-,-,-,-,- S49.9.27,10.347,9.367,8.833,8.517,8.349,8.29,8.24,8.122,8.128,-,-,-,-,-,- S49.9.28,10.354,9.369,8.834,8.518,8.349,8.291,8.24,8.122,8.129,-,-,-,-,-,- S49.9.30,10.368,9.373,8.836,8.519,8.35,8.291,8.24,8.122,8.13,-,-,-,-,-,-
ひどい。政府サイトなのでわざわざ和暦を使いデータの2次利用を妨げています。利率がパーセント(←単位じゃないだろ)なのも使い勝手が悪そう。
ともあれ、DataFrameに読み込むため、和暦を西暦に変換する関数を定義します。ちなみに3行目の:=はPython 3.8で導入されたセイウチ演算子。
def convert_jp_calendar(jp_cal):
    year, month_day = jp_cal.split(".", maxsplit=1)
    if (era := year[0]) == "S":
        year0 = 1925
    elif era == "H":
        year0 = 1988
    elif era == "R":
        year0 = 2018
    else:
        raise ValueError
    return f"{year0 + int(year[1:])}.{month_day}"
この変換関数とPandasのread_csv関数だけで、データをあっさりDataFrameに取り込めます。2行目がヘッダー、欠損値 '-'、エンコーディングはShift-JIS。
import pandas as pd

url = "https://www.mof.go.jp/jgbs/reference/interest_rate/data/jgbcm_all.csv"
df = pd.read_csv(
    url,
    header=1,
    index_col="基準日",
    converters={"基準日": convert_jp_calendar},
    na_values="-",
    parse_dates=True,
    encoding="shift-jis"
)
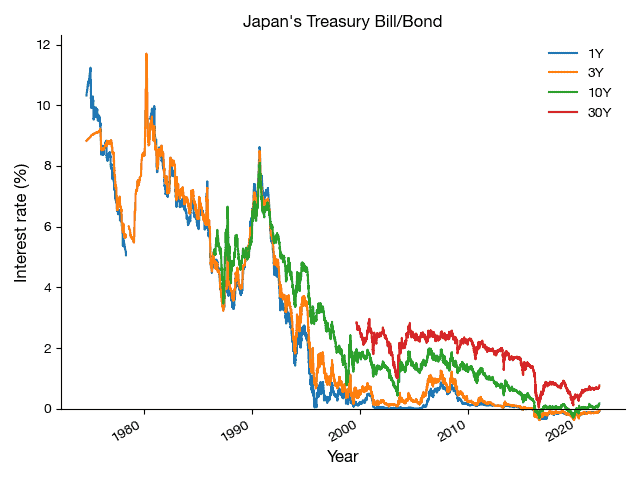
こんな感じになります。短期金利の方が長期金利よりも高い、逆イールドです。石油ショックのせいかな。それにしても、約50年昔の金利が10%前後もあったとは。
df.head(4)
| 1年 | 2年 | 3年 | 4年 | |
| 基準日 | ||||
| 1974-09-24 | 10.327 | 9.362 | 8.830 | 8.515 |
| 1974-09-25 | 10.333 | 9.364 | 8.831 | 8.516 |
| 1974-09-26 | 10.340 | 9.366 | 8.832 | 8.516 |
| 1974-09-27 | 10.347 | 9.367 | 8.833 | 8.517 |
追記
2022/2/18
英語ページから西暦のデータが入手できることに気づきました。上記の和暦→西暦変換は不要です。
import pandas as pd
import numpy as np

url = "https://www.mof.go.jp/english/policy/jgbs/reference/interest_rate/historical/jgbcme_all.csv"
df = pd.read_csv(
    url,
    header=1,
    dtype=np.float16,
    index_col="Date",
    na_values="-",
    parse_dates=True
)
文頭のグラフはこのコードで作成しました。
import matplotlib
from matplotlib import pyplot as plt
from matplotlib import rcParams

matplotlib.style.use("default")
rcParams["legend.frameon"] = False
rcParams["axes.spines.top"] = False
rcParams["axes.spines.right"] = False
rcParams["axes.labelsize"] = "large"
rcParams["font.sans-serif"] = ["Helvetica Neue"]
fig = plt.figure()
ax = fig.add_subplot()
df[["1Y", "3Y", "10Y", "30Y"]].plot(
    ax=ax, xlabel="Year", ylabel="Interest rate (%)", clip_on=False
)
ax.set_ylim(0, ax.get_ylim()[1])
ax.set_title("Japan's Treasury Bills and Bonds")

